ATAS Options Analyzer: Understand the Options Context Behind Futures Moves
By Benjotrade · Reviewed October 3, 2026
A futures chart shows price moving. A footprint shows the volume traded inside that move. Options analysis adds another layer: the positioning and risk exposures that may help explain why some price areas attract activity, why a move loses momentum, or why volatility suddenly expands.
ATAS brings these perspectives into the same workspace through three distinct toolsets: Options Board & Strategy Analyzer, Options Chain Suite, and Options X-Ray Suite. They serve different purposes, use different data, and should not be treated as interchangeable indicators.
This guide explains what each tool does, which subscription includes it, and how futures traders can combine options context with price action, footprint charts and liquidity analysis.
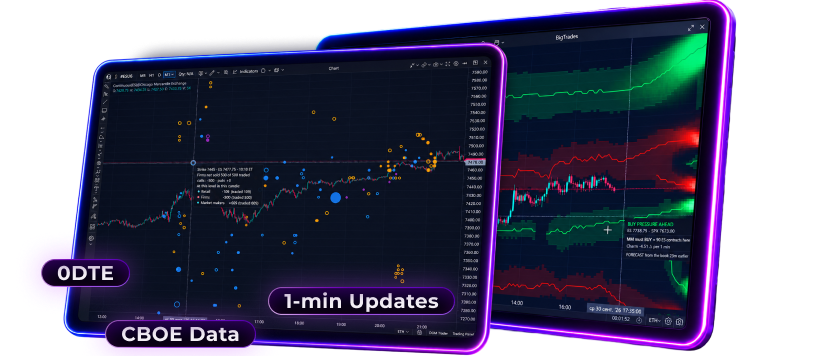
ATAS Options Tools at a Glance
Options Board & Strategy Analyzer
Beta- Main purpose
- Inspect option chains and model strategy outcomes
- Data and connection
- Rithmic or Interactive Brokers; availability depends on connection and instrument
- Availability
- Pro and Ultra; supplied materials identify the modules as Beta
Options Chain Suite
Daily OI- Main purpose
- Analyze strike distributions, open interest, options levels and gamma exposure
- Data and connection
- Daily open-interest context; Rithmic or Interactive Brokers
- Availability
- Pro and Ultra
Options X-Ray Suite
1-min updates- Main purpose
- Add intraday SPX options flow and estimated hedging context to ES analysis
- Data and connection
- Included OptionsDepth analytics based on CBOE data, updated every minute
- Availability
- Ultra
Quick choice: use the Board to inspect contracts and the Strategy Analyzer to explore scenarios. Use Chain Suite for classic options-book context. Use X-Ray for intraday SPX positioning and flow context on the ES chart.
Options Board & Strategy Analyzer: Contracts and Scenarios
ProUltraBetaThe Options Board is the place to explore the options chain itself. Instead of opening separate websites for each expiration, you can inspect series and strikes within ATAS and compare the available contract information.
Depending on the instrument and connected source, the board can show bid, ask, last price, open interest, implied volatility and Greeks. The supplied screenshot shows calls and puts arranged around the strike column, with several expiration series visible in one workspace.
Read the chain before modeling the strategy
The strike identifies the exercise level. The expiration identifies when the contract ends. The bid and ask show the available quotes; their spread matters when evaluating a possible trade. Implied volatility expresses the volatility embedded in the option's price under the pricing model.
Open interest counts outstanding contracts. It differs from trading volume, which counts contracts traded during a period. A large open-interest figure does not reveal, by itself, whether the position is bullish or bearish or which participant holds it.
What the Strategy Analyzer adds
The Options Strategy Analyzer models potential profit and loss across different scenarios. It lets you examine how a strategy may behave when the underlying price changes, time passes, or implied volatility changes.
For example, you may have the correct directional view but discover that time decay or a volatility decline changes the modeled outcome. Comparing scenarios makes these sensitivities easier to understand before treating a payoff diagram as a complete picture.
The supplied feature description also includes delta-hedging analysis. Delta measures an option's sensitivity to a small change in the underlying price. Looking at the combined delta of a strategy helps explain its current directional exposure; that exposure can change as the market moves.
These are modeled outcomes rather than executable quotes. Actual fills, commissions, spreads and contract specifications still matter. ATAS options analytics should also be distinguished from order execution: the supplied product information states that placing options orders directly inside ATAS is not currently supported.
Options Chain Suite: Daily Options Levels on Your Futures Chart
ProUltraDaily OIOptions Chain Suite consists of four indicators. Its emphasis is the classic options book: how open interest is distributed across strikes, where selected options levels sit, and what volatility and gamma estimates imply for the chosen expiration.
It requires a Rithmic or Interactive Brokers connection. The materials list ES, NQ, CL, GC and additional supported instruments; actual coverage depends on the connection and available options data.
Options Chain: OI Profile
OI Profile visualizes open interest across strikes. Depending on the selected display and available data, volume can provide additional context. This helps you identify concentrations in the options book and compare them with areas already relevant to your futures analysis.
Treat a concentration as a reference area to investigate. Open interest alone does not establish the direction of future price movement or reveal the net market-maker hedge.
Options Chain: Key Levels
Key Levels brings selected options-derived reference levels onto the chart, including Max Pain and open-interest-based levels. Displaying them beside price reduces the need to transfer levels manually between tools.
Max Pain is a calculated expiration reference under specific assumptions. It is not a promise that the market will settle there. Likewise, a labeled call or put wall is a useful analytical marker rather than an unbreakable resistance or support line.
Options Chain: Expected Move
Expected Move displays a price range derived from option-implied volatility for the selected expiration. It can help frame a move relative to the volatility priced into the options market.
The range is a statistical estimate. Price can trade beyond it, and the exact interpretation depends on the indicator's calculation and settings. It should not automatically become a take-profit or stop-loss boundary.
Options Chain: GEX Profile
GEX Profile visualizes estimated gamma exposure by strike. Gamma describes how delta changes as the underlying price changes. For traders studying hedging behavior, this helps frame where changes in price may lead to changes in hedge requirements.
Any inference about dealer positioning depends on the model and its assumptions. The same visible open-interest distribution can have different implications depending on who holds which side of the options and how positions are hedged.
The limitation of daily open interest
Daily open interest is valuable for established positioning, but yesterday's snapshot does not show today's newly opened intraday positions. Positions opened and closed within the session are especially important when studying 0DTE activity.
This does not mean every options-chain field updates only once per day: bid, ask and other supplied fields may update according to the feed. The daily limitation concerns the open-interest snapshot used for positioning context. X-Ray addresses a different need by adding minute-level intraday analytics.
Options X-Ray Suite: Intraday SPX Context for ES Futures
Ultra1-min updatesOptions X-Ray Suite contains ten indicators that bring SPX options analytics onto the ES futures chart. According to the supplied product materials, the underlying data and analytics are provided by OptionsDepth under license, with updates every minute.
The separate options analytics feed is included in Ultra. You still need a quote-source connection to open the futures chart itself. A delayed futures connection can display the chart, but its timing should not be mistaken for live futures order flow.
Why SPX options matter to ES traders
SPX options reference the S&P 500 index. ES futures provide exposure to the same underlying equity index, although the futures price and cash index are not identical.
When a market maker takes on options exposure, it may offset some of its directional risk using futures or other instruments. As price, volatility and time change, the hedge requirement can change too. Buying or selling to adjust that hedge can contribute to futures order flow.
A conceptual sequence is: an options trade changes exposure; the dealer evaluates the resulting risk; a hedge may be adjusted; the associated transactions contribute to market activity. This is a possible mechanism, not proof that a particular futures print came from a particular options trade.
Options hedging is one influence among many. Economic releases, cash-equity flows, liquidity conditions and other participants also affect ES. X-Ray adds context without making every price move attributable to options.
Why 0DTE needs intraday information
0DTE means zero days to expiration: an option expires on the trading day being analyzed. With little time remaining, option sensitivities can change rapidly, especially near relevant strikes.
A previous-day open-interest snapshot cannot capture positions that are both opened and closed today. Minute-level analytics therefore offer a different view of how the session develops. Across a full 6.5-hour regular equity session, one-minute updates correspond to roughly 390 snapshots; this describes the sampling cadence, not a guarantee of tick-by-tick coverage.
Group 1 · 5 indicators
What the market maker does to hedge, according to the model
Options X-Ray: Surface Profile
Maps a modeled reaction surface: areas where market-maker hedging may dampen or amplify a move and where the estimated behavior may shift. Use it to form a hypothesis about the surrounding regime, then compare that hypothesis with actual price behavior.
Options X-Ray: Strike Profile
Displays exposure concentrations and options walls by strike and participant group. It helps distinguish the size and location of exposures rather than reducing the entire options market to one headline level.
Options X-Ray: Strike Heatmap
Shows how estimated exposure by strike changes through the session. It makes evolving concentrations easier to compare over time. Minute-level exposure analytics should not be described as official exchange open interest recalculated every minute.
Options X-Ray: GEX Heatmap
Visualizes estimated gamma-related hedging zones through time. Under a simplified positive-gamma dealer assumption, hedging can oppose a move; under a negative-gamma assumption, it can reinforce a move. Actual behavior depends on the position, model and market conditions.
Options X-Ray: Charm Heatmap
Focuses on the effect of time passing on delta. As expiration approaches, hedge requirements can change even without a large underlying-price move. Charm adds this time dimension to the positioning context.
Group 2 · 5 indicators
Who's doing what in the market
Options X-Ray: Expected Move
Displays a volatility-based expected range. Compare it with the Chain Suite's Expected Move rather than assuming the two use identical data, horizons or settings.
Options X-Ray: Big Trades
Highlights large intraday options transactions with position-direction and participant-type context provided by the analytics. A large transaction can belong to a hedge or a multi-leg strategy; size alone does not prove a directional bet.
Options X-Ray: Flow
Separates bought and sold options volume by participant group. The supplied descriptions include Retail, Pros, Firms, Brokers and Intraday traders. These are analytical categories, not named identities of individual traders or funds.
Options X-Ray: Flow Delta
Summarizes directional demand pressure from selected participant groups. It differs from futures footprint delta: the two summarize different markets and should be interpreted on their own terms before comparing them.
Options X-Ray: Market State
Combines information from the suite in a summary panel and distinguishes observed inputs from modeled estimates. This distinction is essential when translating an appealing chart visualization into a trading hypothesis.
Select expirations deliberately
The materials describe viewing expirations separately or together: today's 0DTE, upcoming days, the remainder of the week and monthly expiration. Split mode lets you compare selected groups.
A concentration associated with today's expiration may have a different time horizon from a monthly position. Keep the expiration selection consistent with the question you are asking. Combining everything can hide that distinction.
One Chart, Three Layers of Analysis
Candles and market structure
- Question it helps answer
- Where is price moving, and which areas are being accepted or rejected?
- What it cannot establish alone
- The identity or motive behind the flow
Footprint and futures volume
- Question it helps answer
- How are aggressive trades interacting with price?
- What it cannot establish alone
- Whether an options hedge caused the activity
Options analytics
- Question it helps answer
- Which option exposures, flows and modeled hedge zones may matter?
- What it cannot establish alone
- A guaranteed direction or an automatic entry
This combination is useful because the layers answer different questions. An options level creates a reason to pay attention. A footprint helps examine what happens when price arrives. Price structure shows whether that interaction produces a meaningful change.
Heatmap can add the visible resting liquidity around the area. Futures Big Trades can highlight larger executions. Options X-Ray: Big Trades refers to options activity, so avoid confusing it with the platform's futures trade-size tools.
A Practical ES Analysis Workflow
Before the session
Start with the broader structure: previous-session high and low, overnight range and relevant volume-profile areas. Review the economic calendar. Add selected options levels and expected-move context rather than loading every available indicator at once.
Choose your expiration horizon. For an intraday question, examine today's 0DTE context separately from longer-dated exposure. Note which elements are daily positioning and which are minute-level estimates.
When price approaches a relevant zone
Observe the futures market's response. Does price stop extending despite aggressive selling? Does a breakout hold outside the area? Does a retest show acceptance or rejection? Use your footprint, liquidity tools and established trading rules to answer these questions.
A hypothetical reversal case would be price testing an options-related zone near a previously identified low. If selling continues but new lows fail to hold, and price then reclaims structure, you have observations to evaluate. The options zone alone does not provide that confirmation.
A hypothetical continuation case would be price breaking through the zone and accepting beyond it while aggressive flow continues. A modeled amplification regime may add context, but the breakout still needs to meet your execution and risk criteria.
After the session
Save the chart and record what you knew at the time. Separate the observed price response from the options model you were using. Note the active expirations, relevant indicator settings and data timestamps.
Review both successful and failed reactions. One persuasive screenshot is not evidence of a repeatable strategy. The useful question is whether the additional context consistently improves your decisions under comparable conditions.
Data Requirements: What Is Included and What Is Separate?
| Requirement | Board & Strategy Analyzer | Chain Suite | X-Ray Suite |
|---|---|---|---|
| ATAS subscription | Pro or Ultra | Pro or Ultra | Ultra |
| Options connection | Rithmic or Interactive Brokers | Rithmic or Interactive Brokers | Included options analytics feed |
| Separate X-Ray options subscription | Not applicable | Not applicable | Not required according to supplied materials |
| Futures chart quote source | As required for the chart being analyzed | As required for the chart being analyzed | Still required; delayed quotes can display the chart |
| Main time perspective | Contract inspection and strategy scenarios | Daily OI-based positioning context | Intraday updates every minute |
The distinction prevents a common misunderstanding: included X-Ray options analytics do not make every futures market-data connection free. Broker entitlements, exchange subscriptions and real-time futures data requirements remain separate from the included options analytics.
Which ATAS Plan Do You Need?
| Feature | Start | Plus | Pro | Ultra |
|---|---|---|---|---|
| Options Board & Strategy Analyzer | Not included | Not included | Included | Included |
| Options Chain Suite | Not included | Not included | Included | Included |
| Options X-Ray Suite | Not included | Not included | Not included | Included |
For the tools covered here, Pro includes the Board, Strategy Analyzer and Chain Suite. Ultra adds Options X-Ray Suite. Choose by the analysis you want to perform rather than assuming that a larger indicator collection automatically produces better decisions.
Check current ATAS plan terms before subscribing. This article intentionally does not hardcode subscription prices or temporary discount percentages.
Training: Learn the Data Before Relying on the Display
The supplied ATAS materials describe an options course with 16 lessons, provider sessions from OptionsDepth, live webinars and partner training. Listed languages vary by format: provider sessions include English, German and Spanish, while webinars are described in English and German.
Start with the underlying concepts: calls and puts, expirations, open interest, implied volatility and Greeks. Then study how each indicator converts its data into a chart display and which assumptions belong to the model.
Use the current ATAS training schedule for actual access and session availability. An announced course or webinar is not a promise that every session is running immediately or that every language version is already accessible.
Frequently Asked Questions
Add Options Context to Your ATAS Workspace
ATAS's options toolsets extend the workspace from contract inspection and scenario modeling to daily options levels and intraday SPX analytics. The most useful setup is one you can interpret clearly: selected expirations, a few relevant indicators, synchronized data, and an established decision process.
Explore the toolset that matches your question, then compare its context with the futures market's actual response.
This guide explains analytical tools and hypothetical workflows. It does not report a personal performance test of the new tools. Screenshots illustrate historical interfaces and modeled data.
Sources and Product Information
- User-supplied ATAS options feature descriptions, plan matrix and screenshots, reviewed October 3, 2026.
- ATAS current pricing and feature comparison
- ATAS Help Center for current indicator documentation and supported instruments.
- ATAS-BJT for the existing site layout and current offers.