ATAS Web Version: Test Order Flow Analysis in Your Browser
Last updated August 2026
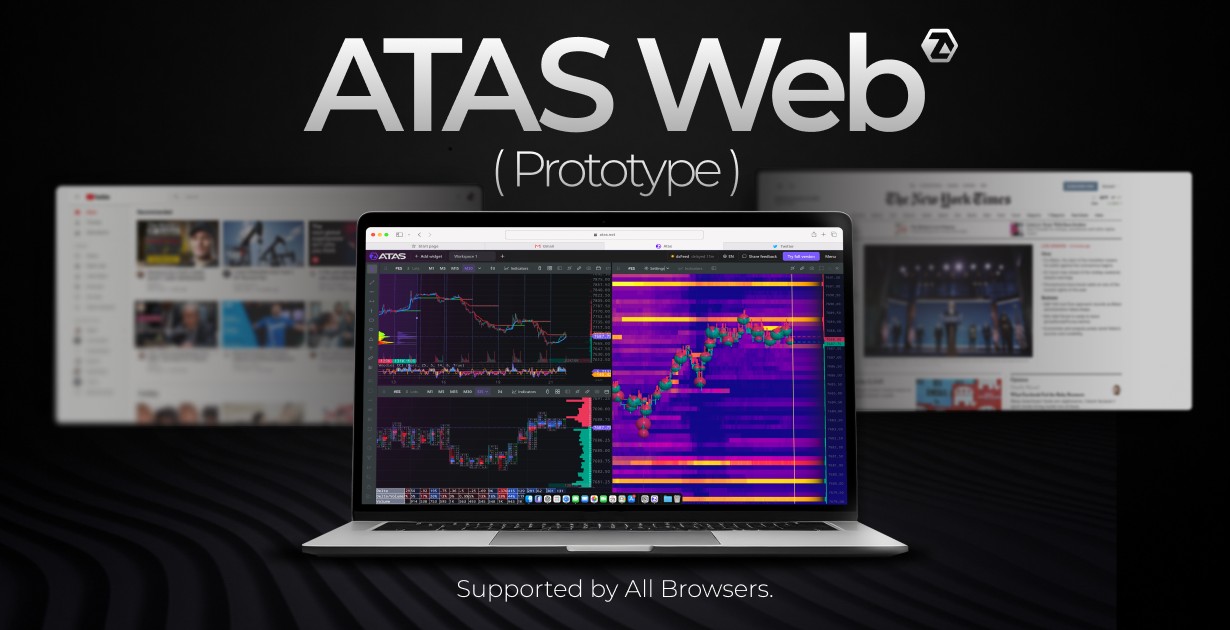
Want to explore ATAS without installing the desktop platform first? The new ATAS Web Version makes selected order flow and volume-analysis tools available directly in your browser. The current prototype lets you explore Heatmap, Footprint charts, multiple chart types and more than 240 indicators through an accessible browser-based interface.
ATAS Web is still in active development. It is not a separate product and it is not designed to replace the desktop platform. Instead, it provides a convenient first step into the ATAS ecosystem for users who want to explore the interface, analyze charts and test core tools.
Partner link — using it supports this site at no extra cost to you.
Important: ATAS Web currently supports analysis and testing. Connecting your own exchange or broker and independently managing or executing orders are available only through the desktop application at this stage.
What is ATAS Web?
ATAS Web brings selected features of the ATAS analysis platform into a web browser. It creates a simpler starting point for users who want to become familiar with volume analysis, Footprint charts and the ATAS workflow without first setting up the full desktop environment.
After accessing the prototype and signing in, users can open the browser interface, build workspaces and explore several tools that make ATAS useful for detailed chart analysis.
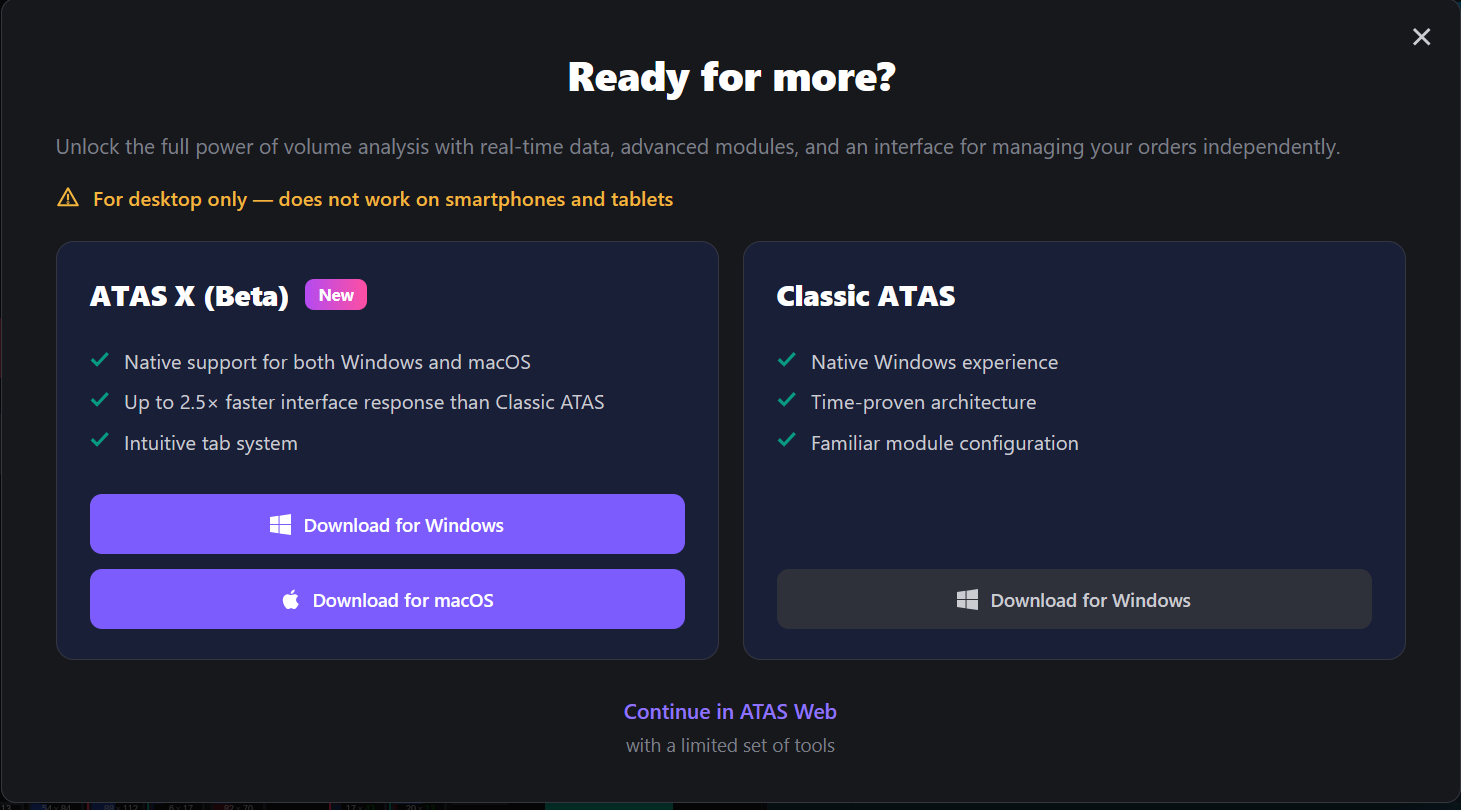
The web prototype is not a complete browser-based trading terminal. Its current purpose is to make exploration and analysis more accessible. The desktop application remains the more complete environment for deeper market analysis, broker and exchange connectivity, advanced modules and independent order management.
ATAS is actively developing the prototype and collecting feedback. User experience and feature requests can therefore help influence which capabilities are prioritized next.
Why use ATAS in the browser?
Specialized order flow software can feel complex when you first encounter it. ATAS Web lowers that initial barrier by allowing you to explore the platform through a familiar web interface.
You can examine how Footprint charts display Bid and Ask activity, compare different chart types, apply indicators and arrange widgets in a workspace. This makes the prototype useful for building an initial understanding of the ATAS approach before moving to a full desktop setup.
The browser version is especially interesting if you want to:
- explore ATAS without a traditional desktop installation
- view Footprint and volume-based charts for the first time
- test selected analysis tools before setting up a complete workflow
- become familiar with the interface and workspace concept
- experience the development of ATAS Web and submit feedback
What is already available in ATAS Web?
Although ATAS Web is still an early prototype, several important tools are already available for testing.
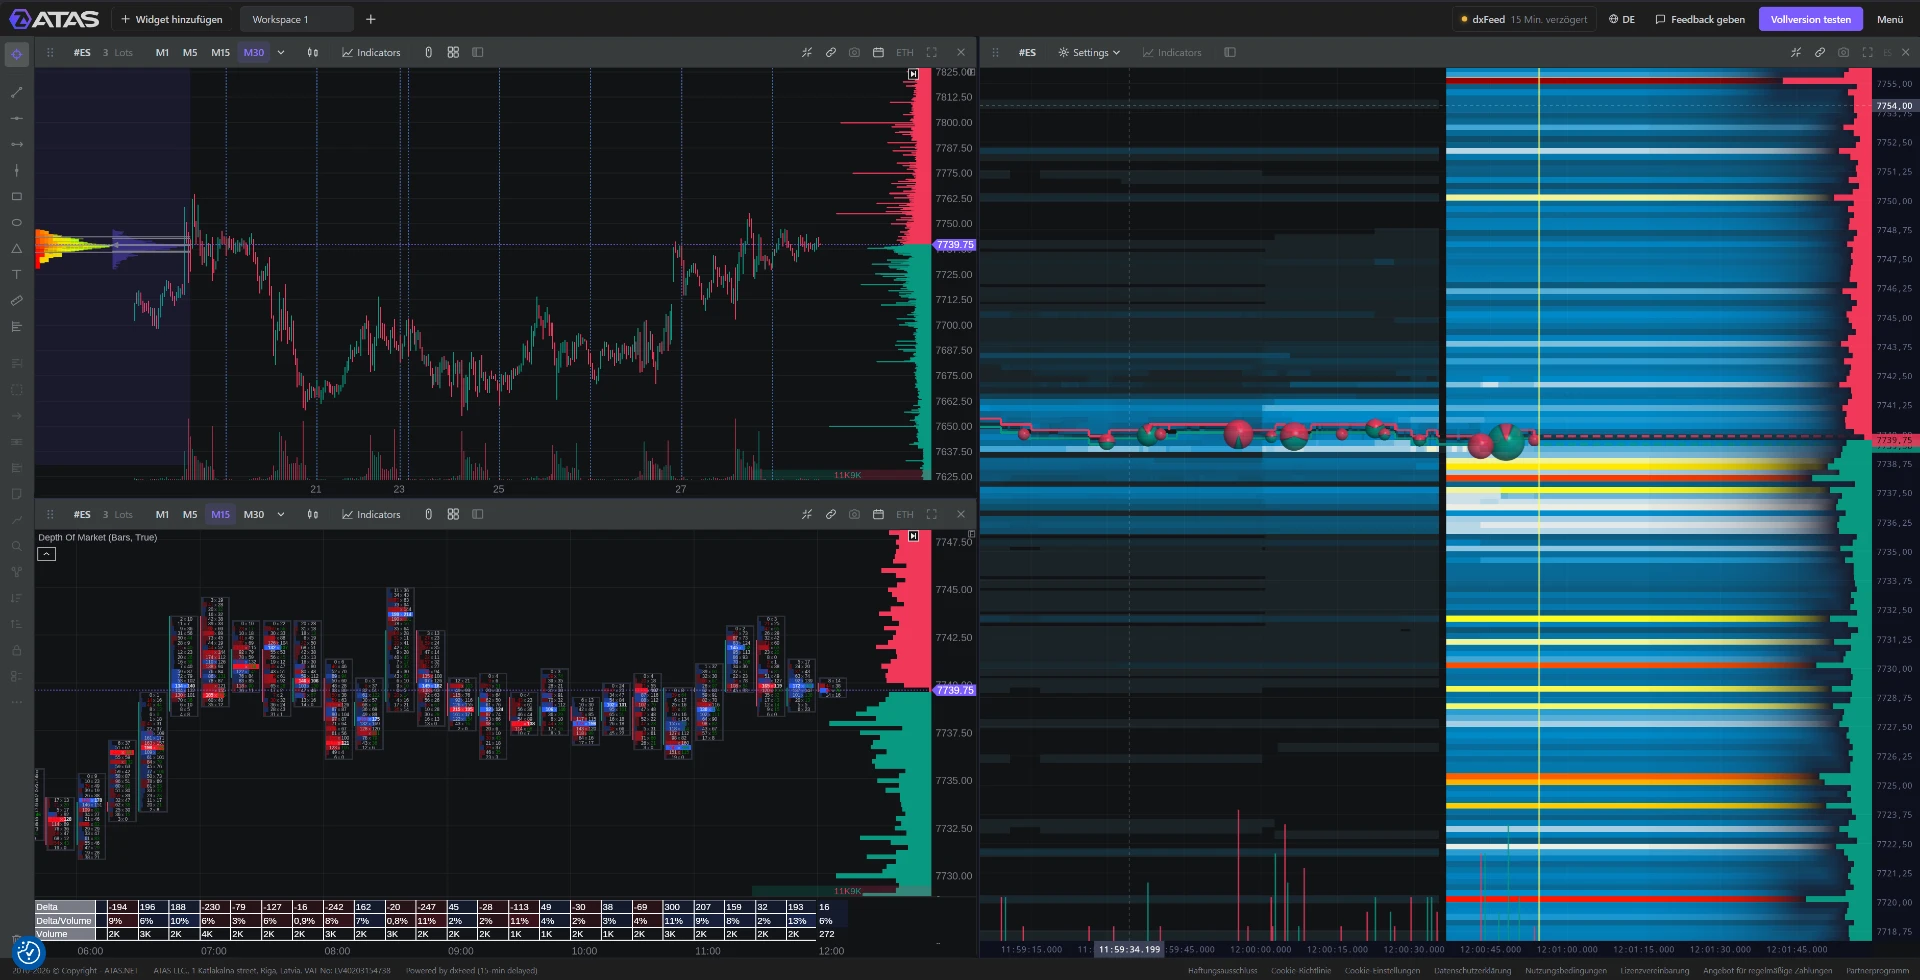
Heatmap Beta with bubbles
The Heatmap is currently in beta and provides a visual way to explore market activity. Together with bubbles and basic indicators, it helps you inspect areas of interest and volume events directly inside the chart.
Bid/Ask Footprint charts
ATAS Web includes a Bid/Ask Footprint as well as traditional candlestick charts. A candlestick mainly shows Open, High, Low and Close — a Footprint adds a detailed view of the traded volume inside the candle.
Multiple chart types and periods
Standard time-based charts plus Tick, Volume, Delta and Range charts, so you can compare market activity built on time, transactions, volume, delta or price range.
More than 240 indicators
ATAS Web already includes more than 240 volume and technical indicators. Custom user-created indicators are not currently supported in the web prototype.
Classic drawing tools
Classic drawing tools are available for manual chart work — mark relevant price areas and add visual structure to an analysis. The exact feature set may change as the prototype develops.
Flexible workspaces
Widgets can be freely combined in flexible workspaces, so you can arrange charts and tools into a browser-based analysis view that suits your workflow.
Preview data from dxFeed
ATAS Web provides preview quotes through dxFeed with a 15-minute delay. This is enough to explore the interface and test analysis functions, but it is not a real-time feed for active trading.
How to access and test ATAS Web
ATAS Web is a prototype and is not reached through the standard public product flow. Use the access button on this page to open it.
- Click Test ATAS Web on this page.
- Sign in with your ATAS account or follow the available registration flow.
- Open the web interface directly in your browser.
- Select a chart or create a workspace.
- Explore Heatmap, Footprint, indicators and drawing tools.
- Use Share Feedback to tell ATAS about your experience.
No traditional desktop installation is required for this initial browser-based test.
Can you trade with ATAS Web?
No — independent trading is not currently available in the ATAS Web prototype. Users cannot yet connect their own exchanges or brokers through the web version or use it for independent order management and execution.
The prototype should currently be understood as an analysis and testing environment. You can open charts, explore the interface and try selected tools. If you need to connect a broker or exchange, manage orders or use the more complete ATAS workflow, you need the desktop application.
This distinction is essential: ATAS Web reduces the barrier to exploring the platform, while the desktop version remains the path to the broader professional workflow.
ATAS Web vs. the desktop platform
| Feature | ATAS Web Prototype | ATAS Desktop / ATAS X Beta |
|---|---|---|
| Browser access | Yes | Desktop application |
| Traditional installation required for initial exploration | No | Yes |
| Heatmap and Footprint tools | Selected tools available | Broader desktop experience |
| 240+ indicators | Yes | Extensive desktop toolset |
| Custom indicators | Not currently available | Depends on the desktop version and setup |
| Included preview data | dxFeed, delayed by 15 minutes | Data-feed or connection setup required |
| Connect your own exchange or broker | Not currently available | Available |
| Manage and execute orders | Not currently available | Available |
| Best suited for | Exploring, analyzing and testing | Deeper analysis and the complete workflow |
The features of the web prototype may change during active development. Check the latest information from ATAS before making workflow or platform decisions.
Who is the ATAS Web Version for?
ATAS Web can be useful for:
- beginners who want a simpler introduction to ATAS
- traders exploring Footprint and volume-based charts
- users who want to inspect the platform before configuring the desktop application
- people looking for quick browser access to selected analysis tools
- existing ATAS users who want to test the new interface and support its development with feedback
If you already need live trading, exchange and broker connections, independent order management or the complete set of advanced modules, the desktop application remains the appropriate option.
Help shape the development of ATAS Web
The current ATAS Web Version is a prototype built to collect real user feedback. That makes your experience valuable. Feedback can help ATAS understand which workflows are useful, where the browser interface needs improvement and which functions users would like to see prioritized.
You can submit your experience through the “Share feedback” option in the web terminal or use the dedicated button on this page.
Your feedback can help shape ATAS Web
Test the prototype, explore the available tools and tell ATAS what works well, what is missing and what should be improved next.
Conclusion: A simple way to explore ATAS online
ATAS Web makes it easier to take a first step into volume and order flow analysis. The prototype already includes Heatmap Beta with bubbles, Bid/Ask Footprint charts, several chart types, drawing tools, flexible workspaces and more than 240 indicators. Delayed preview quotes allow users to explore these features without first installing the desktop platform.
The web version is not currently intended for independent trading. Broker and exchange connections and order management remain available through the desktop application. However, if you want to understand the interface, analyze charts and test core ATAS tools, the browser prototype offers an accessible starting point.
Test the prototype through this page and use the feedback option to share your experience with ATAS.
Frequently asked questions about ATAS Web
What is ATAS Web?
ATAS Web is a browser-based prototype containing selected analysis functions from the ATAS ecosystem. It provides a simpler way to explore ATAS and is not a separate product or a complete replacement for the desktop platform.
Do I need to install ATAS Web?
No. The prototype opens directly in a web browser and does not require a traditional desktop installation for the initial test.
How can I access ATAS Web?
Use the Test ATAS Web button on this page. The prototype is not currently accessed through the standard public product flow, so the dedicated access link is required.
Can I trade through ATAS Web?
Not independently at this stage. Connecting your own exchange or broker and managing or executing orders are currently available only through the desktop application.
Does ATAS Web include real-time data?
The prototype includes dxFeed preview quotes delayed by 15 minutes. This should not be treated as a connected real-time data feed for active trading.
Which charts are available in ATAS Web?
Available options include candlestick charts, Bid/Ask Footprint and standard time-based, Tick, Volume, Delta and Range charts.
Can I use custom indicators?
Custom indicators are not currently available in ATAS Web. The prototype does, however, include more than 240 volume and technical indicators.
Does ATAS Web replace the desktop version?
No. ATAS Web provides a browser-based entry point for analysis and testing. The desktop platform remains the more complete option for deeper market analysis, advanced modules, exchange and broker connections and independent order management.
How can I send feedback?
Use Share Feedback on this page or the "Share feedback" option inside the web terminal. Feedback helps ATAS evaluate which functions and improvements should be prioritized.